
Where Did the Seals Go?
Basic Research Question 8: How does the seal population in Fishers Island Sound change over the course of a year?
Harbor seals migrate seasonally to Fishers Island Sound from the Gulf of Maine. Seals come to Fishers Island Sound to feed on fish, rest, and stay warm during the winter months. At Project Oceanology, we typically begin seeing the seals in October. In approximately late April, they migrate north back to the Gulf of Maine and nearby Canadian waters for their pupping and breeding seasons.
The graphic below shows the migration ranges. ‘Stranding’ is when seals are found in distress on beaches - seals that wander too far south are in trouble and usually must be rescued and returned to colder northern waters. Locate Long Island Sound on the map below, and think about when you think the most seals are likely to be here (Fishers Island Sound is in the eastern part of Long Island Sound).
Source: NOAA NEFSC
Part A: Prediction and Reasoning
Write answers to the following prompts on your sheet of paper.
1. Make a prediction: What time of year would you expect to see the most seals in Fishers Island Sound?
2. Explain your reasoning: WHY do you think that the number of seals we observe would change over the course of a year?
Part B: Analyze the Data
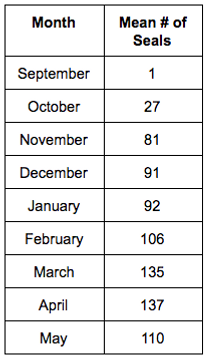
Look at the dataset below. On your piece of paper, illustrate the data by making a graph. Your graph should have clear labels on both the x-axis and the y-axis. The type of graph (scatterplot, column graph, etc) is up to you.
Part C: Interpret the Results and Make Arguments from Evidence
Write answers to the following prompts on your sheet of paper.
1. Make a claim that answers the research question (one sentence).
2. What evidence was used to write your claim? Reference specific parts of your graph.
3. Explain your reasoning. Make sure to connect your answer to what you have learned about seals and tides.
4. Was your prediction supported by the results? Use evidence to explain why or why not.
5. Think back to our scenario at the beginning. Based on today’s date, does your data point (20 seals) or your friend’s data point (200+) fit the pattern for this month?
6. How would you follow up? Describe a new question that should be investigated to build on these results, and what future data should be collected to answer your question.
Congratulations! Your final analysis should include the following components:
-
Your answers to the two video questions
-
A statement of the research question that you chose/were assigned
-
Your prediction and your reasoning
-
Your labelled graph
-
Your answers to the results questions
Share your results with your teacher, and/or by emailing it to Project O: projecto@oceanology.org, attn: Dr. Molly