
Where Did the Seals Go?
Advanced Research Question 3: How do air and water temperature interact to affect the number of seals observed?
Harbor seals migrate seasonally to Long Island Sound from the Gulf of Maine. The graphic below shows the migration ranges.
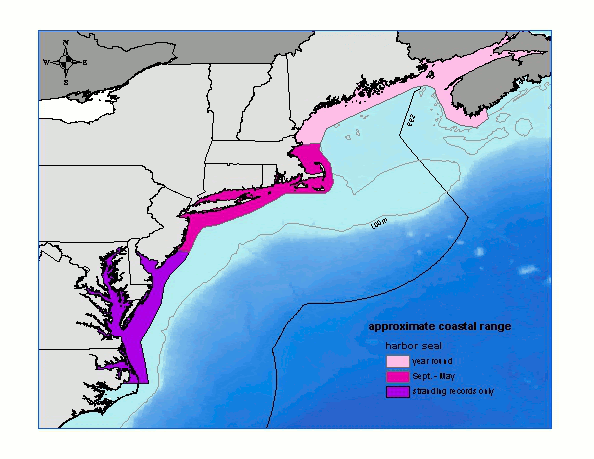
Source: NOAA NEFSC
Locate Long Island Sound on this map. Consider seasonal air and water temperatures in each of the ranges. [Note: “stranding” refers to when a seal is found in distress on a beach and is unable to return to the water.] The seals in Fishers Island Sound divide their time between rocky ‘haul-out’ locations and the water, so the number of seals observed by Project Oceanology students may be influenced by both air and water temperature.
Seals have many physical and behavioral adaptations for maintaining their internal temperature, a process known as thermoregulation. A harbor seal’s core temperature is about 37.8℃ (100℉), which means that they are constantly losing heat to the cold water that surrounds them. Seals combat this heat loss in several ways. First, their metabolic rate is somewhat higher than land mammals of the same size. This high metabolism helps them generate body heat for warmth. Second, their bodies are insulated by thick layers of blubber (up to 30% of their body mass!) and also (to a small extent) by their fur. Third, while they are in the water, blood vessels in their skin contract, shunting blood inward to the core of the body and reducing heat loss at the surface. Finally, seals can warm up by ‘hauling’ out on the rocks. While they are on the rocks, the skin blood vessels dilate, allowing greater heat exchange between the seal and the environment.
The image below shows thermal images of the surface temperature of a seal pup that has been basking in the sun (left), and the same seal pup after a 20 minute swim in cold water.

Image: Tang et al. 2013, 44th Conference of the International Association of Aquatic Animal Medicine
Whether or not a seal hauls out on the rocks will be influenced by both the water temperature and the air temperature, and by whether or not hauling out will help the seal regulate its body temperature.
Part A: Prediction and Reasoning
Write answers to the following prompts on your sheet of paper.
1. Make a prediction: At what combination of air and water temperatures would you expect to see the most seals hauled out on the rocks?
2. Explain your reasoning: WHY do you think that the number of seals hauled out would be greatest under these conditions?
Part B: Analyze the Data
Look at the dataset below. It shows the mean number of seals observed at different combinations of air and water temperature. On your piece of paper, illustrate the data by making a graph. Your graph should have clear labels on both the x-axis and the y-axis. The type of graph (scatterplot, column graph, etc) is up to you.

Part C: Interpret the Results and Make Arguments from Evidence
Write answers to the following prompts on your sheet of paper.
1. Make a claim that answers the research question (one sentence).
2. What evidence was used to write your claim? Reference specific parts of your graph.
3. Explain your reasoning. Make sure to connect your answer to what you have learned about seal biology and about air and water temperatures.
4. Was your prediction supported by the results? Use evidence to explain why or why not.
5. Think back to our scenario at the beginning. Water temperature does not change much over the course of a single week, so let’s assume the water temperature was about the same between the two trips. Air temperature, on the other hand, can change a lot. How do you predict the air temperature varied between your trip and your friend’s trip, and why?
6. How would you follow up? Describe a new question that should be investigated to build on these results, and what future data should be collected to answer your question.
Congratulations! Your final analysis should include the following components:
-
Your answers to the two video questions
-
A statement of the research question that you chose/were assigned
-
Your prediction and your reasoning
-
Your labelled graph
-
Your answers to the results questions
Share your results with your teacher, and/or by emailing it to Project O: projecto@oceanology.org, attn: Dr. Molly