
An Oyster Growers Dilemma
Research Question: Where along the Thames River are salinity levels best for oyster growing? Make sure you consider how conditions will change seasonally.
Part A: Background
Salinity
Salinity is the measurement of salt concentration in water. Salinity is usually measured in parts per thousand (ppt). Oceans are consistently salty with the average salinity of about 35 ppt while freshwater environments like lakes and ponds have little to no salt (0 ppt). Estuaries are environments where ocean water and river water meet and mix. This makes the salinity variable. The salinity increases at the mouth of the river because it’s closer to the salt water source and becomes less salty as you move towards the head of the river or farther away from the salt water. Salinity also can change seasonally in estuaries: it tends to be lowest during times of high freshwater input (for example, when rivers are running high due to rainfall or snow melt).
Oysters and Salinity
Oysters can tolerate a wide range of salinities, but not all salinities are ideal for oyster growth and survival. Scientists at Stonybrook University studied the effect of salinity on oyster growth, survival, and vulnerability to disease in Long Island Sound. They found that oysters grew faster in higher salinities, but were also more vulnerable to diseases. They also found that oyster survival was higher in sites with salinity greater than 10ppt.

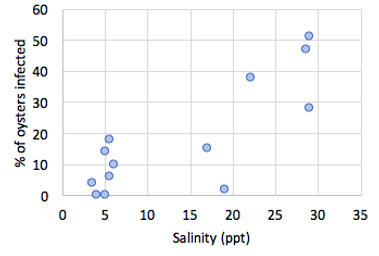
Data from Levinton et al. 2011, “Climate change, precipitation, and impacts on an estuarine refuge from disease” PLoS One 6(4) e18849
Oysters measuring 50mm were put out into the water at different salinities, and then re-measured after three months.
Percentage of oysters infected with the parasite Haplosporidium nelsoni (MSX) over a three month period. MSX can devastate oyster farms.
Finally, salinity can also affect the taste of oysters! Check out this guide to oyster eating, and think about how you want your oyster product to taste.
Part B: Prediction and Reasoning
If you haven’t already, take the Google Earth tour and think about how the Thames River might vary from its headwaters (where it starts, in Norwich) to its mouth.
Write the answers to the following questions on your sheet of paper.
-
Make a prediction. Where along the Thames River do you expect the salinity to be the highest? Specify a sampling location (labelled A-F on the map).
2. At the location you chose above, what season of the year do you expect the salinity to be the highest?
3. Explain your reasoning. WHY do you think the salinity will be highest at that location/in that season?
Part C: Analyze the Data
Look at the dataset below. On your piece of paper, illustrate the data by making a graph. Your graph should have clear labels on both the x-axis and the y-axis. The type of graph (scatterplot, column graph, etc) is up to you.
This table shows the mean salinity we measured at each location along the Thames River. Each number is an average of many trips. A blank space indicates that Project Oceanology does not have data for that location at that season.

Part D: Interpret the Results and Make Arguments from Evidence
Write answers to the following prompts on your sheet of paper.
1. Make a claim that answers the research question at the top of this section (one sentence).
2. What evidence was used to write your claim? Reference specific parts of your graph.
3. Explain your reasoning. Make sure to connect your answer to what you have learned about oyster biology, salinity, and seasonal change in the Thames River.
4. Was your prediction supported by the results? Use evidence to explain why or why not.
5. Are these readings within the normal range for this area? Standard Ranges for Water Chemistry
6. Revisit the prediction you made at the very beginning, about where might be the best place for an oyster farm. Has your choice of location changed based on what you have learned about oysters, salinity, and seasonality? Explain why or why not.
7. How does salinity change with seasons in the Thames River, and how would you expect these seasonal changes to affect oysters?
8. How would you follow up to learn more about the potential impacts of salinity and seasons on your oyster farm? Describe a new question that should be investigated to build on these results, and what future data should be collected to answer your question.
Congratulations! Your final analysis should include the following components:
-
Your initial prediction and reasoning about the best location for an oyster farm.
-
A statement of the research question that you chose/were assigned
-
Your prediction and your reasoning about the research question
-
Your labeled graph
-
Your answers to the results questions
Share your results with your teacher!