
Shorebird Identification (High School)
Follow the steps of the eBird Scavenger Hunt below. Click on any images to zoom in.
Below steps 3, 4, 5, 6 and 9 you will find a question. Write the answer to each question in your notebook.
Section 1
Step 1: Navigate to ebird.org. Click “Get Started” and create a profile using your school email.

Step 2: Click “Explore” and enter the species name Piping Plover to find its information page.


Step 3: Under Weekly Bar Chart, enter Connecticut as the region. Mouse over the graph it generates to find the month where Piping Plovers are spotted most frequently by people in Connecticut.


Question 1: During what month are Piping Plovers spotted most frequently in Connecticut?
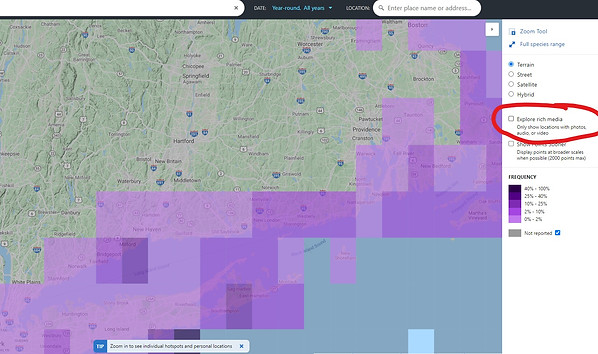
Step 4: Click on “Large Map” to view data about locations where Piping Plovers have been seen. In the large map view, filter by dates. Choose the month(s) that you found in the last question, and use “all years.” Identify any areas where a larger percentage of Piping Plovers have been reported in Connecticut.


Question 2: In what town has the largest percentage of Piping Plovers been reported during June and July?
Step 5: Start zooming in on the town you chose for the last question. Click “explore rich media” to see locations where photos, audio, or video of Piping Plovers have been uploaded. Birder Michael Hall visited Silver Sands State Park on July 13th, 2018. Click on his checklist.
Question 3: How many Piping Plovers did Martin Hall see on 7/13/18?
Step 6: Your friend wants to go to Milford to see some Piping Plovers, but would like to avoid bumping into lots of other birders.
Question 4: Based on Piping Plover sightings in June of 2021, which location in Milford should you recommend to your friend?
Section 2
eBird also has a wealth of data organized by region, or by National Wildlife Refuge. There are two NWR in Connecticut, but we will focus on one: Stewart B. Mckinney National Wildlife Refuge, in Westbrook.
Step 7: Return to ebird.org/explore. On the right, look for the picture of the goose and click the link for National Wildlife Refuges (NWRs). This will reload the page with the search bar now filtering for NWRs. Enter Stewart B. Mckinney and search.


Step 8: Every bird ever recorded in the refuge is in this dedicated database, and scientists can access this data at any time! Let’s take a look at the American Oystercatcher numbers in the refuge. On the left of the screen, click Bar Charts.

Step 9: Use the “Find” function on your computer to find American Oystercatcher (ctrl-F, or command F). Click the tiny line graph icon-- this will take you to where you can find detailed information about American Oystercatcher sightings in the refuge. Use the tabs to find the graph for Totals. The line graph generated shows the total number of American Oystercatchers reported during that week of the year since 1900. The bar graph below shows the number of checklists reporting American Oystercatchers. The histogram at the top, shows the frequency of American Oystercatcher sightings reported on all submitted checklists.


Question 5: What week of the year has the highest total number of American Oystercatchers reported in Mckinney NWR? What is that total? What lurking variables, or unintended influences may be skewing this number?
Step 10: A different way to think about how many American Oystercatchers are living within the Mckinney NWR is to use a metric called Abundance. Click the tab labeled abundance to see this data. This metric shows the average number of American Oystercatchers.
